These maps portray physical, social, political, cultural, economic, sociological, agricultural, or any other aspects of a city, state, region, or nation.
Unclassed choropleth maps use gradient shading without having to specifically categorize data. Usually the darker the shading the higher the number or percentage is.
Standardized Choropleth
Maps are standardized so that information can be compared without bias. The map above standardizes the percentage of individuals aged 14 and under in Canada in 2006.
Unstandardized choropleth maps fail to report relativity of data. These maps can be misleading as the fail to reveal any control. There is no set variable in which we can measure the magnitude of the data.
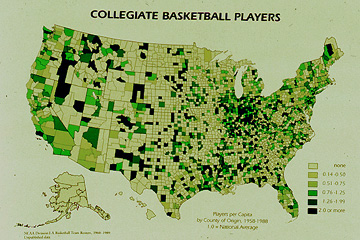
Nominal choropleth maps display nominal data. In the map above as the number per capita of collegiate basketball players increase, the color gets darker.
Line graphs are normally used to compare two different types of data. Usually the vertical scale(dependent variable) is affected by the horizontal scale (independent variable). Line graphs can be altered and can mislead if numerical scales are not represented correctly. The map above is a multi line graph that displays the population of five states over a period of 100 years. Florida had the most exponential growth from 1970 to 2000.
Interactive maps allow users to proactively navigate a map illustration. Users can zoom in and out over a large or small area. As you can see in the map above the smaller picture is a zoomed in view of the larger map.
LIDAR Mapping Light Detection and Ranging (LIDAR) is a remote sensing system used to collect topographic data.
LIDAR uses laser pulses,
measuring the time delay between the transmission of the laser pulse
and the detection of the reflected signal, to determine the range of an object. This type of mapping has been very beneficial to meteorologist and was the basis of the Global Positioning System.